KNOXVILLE, Tenn. — Think Tennessee released its State of Our Counties Dashboard recently. The goal of this dashboard is to make data and research "more accessible and actionable" for Tennesseans.
According to Think Tennessee, the county dashboard contains data from dozens of sources and creates interactive visualizations to help make information easier to find. It covers a variety of data types, from credit scores, average wages, air pollution rates, flood risk, child care centers, average commute to work and more. It's an expansive collection of data designed to provide information on many different topics.
"Overall, the county dashboard shows that there are immense opportunities for counties to collaborate, whether partnering together to find solutions to shared challenges or learning best practices from counties that have achieved success," Think Tennessee said.
Results from the dashboard
According to the dashboard, almost every county in Tennessee has strong GDP growth and low unemployment.
"Lay, DeKalb, Hawkins, Haywood, Moore, Polk, Rhea, and Stewart Counties showed double-digit GDP growth between 2021 and 2022," the dashboard said. " The average Tennessee county has a 3.7% unemployment rate."
The dashboard also said despite the strong economic indicators, Tennesseans are struggling to make ends meet due to low incomes and high debt in almost every county. The dashboard highlights that the average median household income is around $51,734.
"In almost all counties, the average wages and salaries and/or median household income is anywhere from $10,000 to $20,000 short of the average cost of living, which stands at $69,367," Think Tennessee said.
Roughly one-third of people in the average Tennessee county have debt in collections or are delinquent in their debt, the dashboard said.
The dashboard also said the low incomes are worsened by the lack of access to affordable housing and childcare.
"In the majority of Tennessee counties (50 of 95), families working two full-time minimum wage jobs would not earn enough to afford a two-bedroom unit at fair market rent," the report said. "A family with two children spends an average of 24.3% of their household income on childcare in Tennessee counties."
When it comes to East Tennessee counties, Knox County had a GDP growth of 2.3% between 2021 and 2022, while the average Tennessee County of 3.6%. Sevier County GDP growth came in at 4.5%, Blount at 5.9% and Loudon at 2.9%.
Knox County


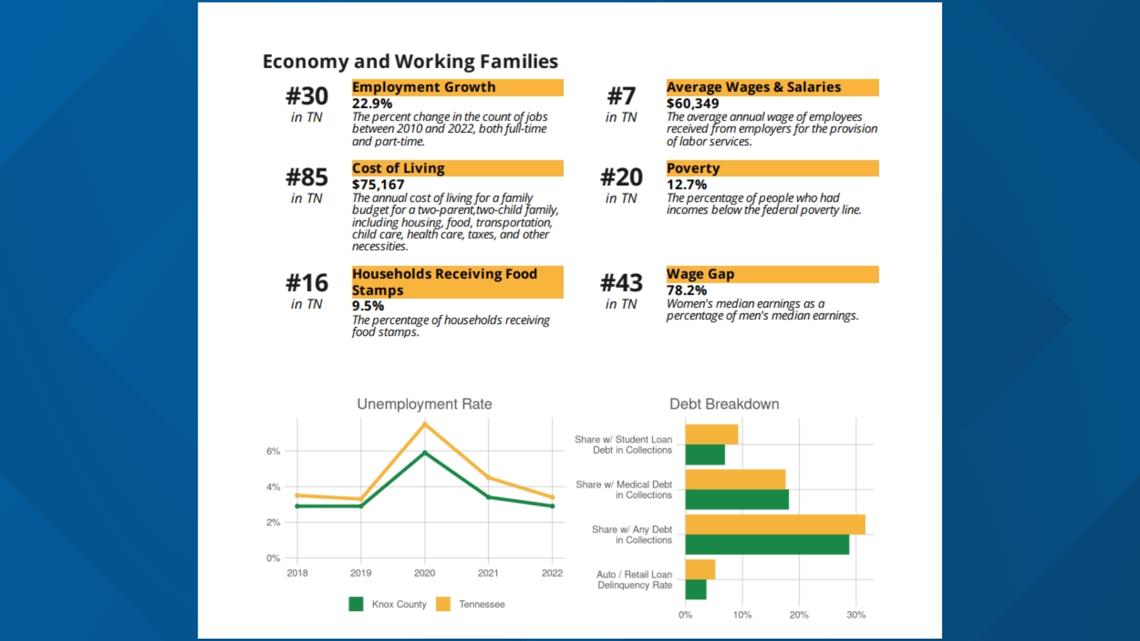
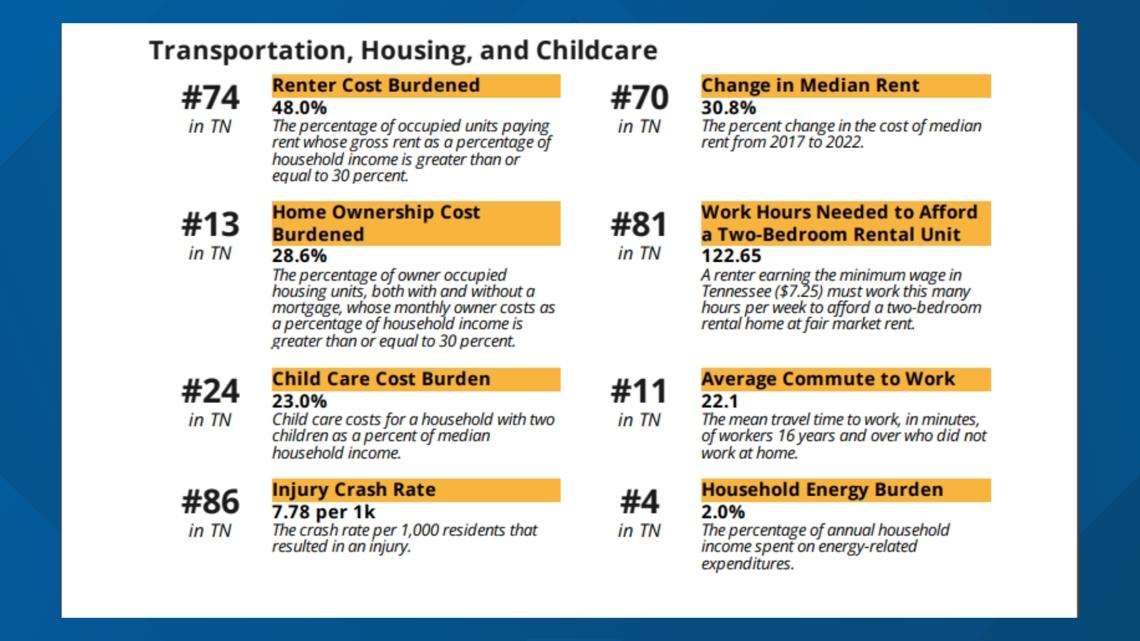
According to the dashboard, the average median rent in Knox County went up 30.8% from 2021 to 2022, with the average Tennessee County going up by 25.1%. To afford a two-bedroom rental unit in Knox County, people would need to make at least $46,240 per year while the state average was $35,778 per year.
Knox County ranked 85 in cost of living at $75,167 per year for a two-parent, two-child family. It had an average income of just over $60,000 per year.
The report also said working at the minimum wage in Knox County, an employee would need to work over 122 hours a week in order to afford a two-bedroom rental unit at fair market rent.


It found that Knox County had around 92 fatal drug overdoses per 100,000 people — around 30 overdoses higher than the average rate in Tennessee. It also found that around 48% of renters in the county were cost-burdened, compared to around 43.5% across the state.
Blount County
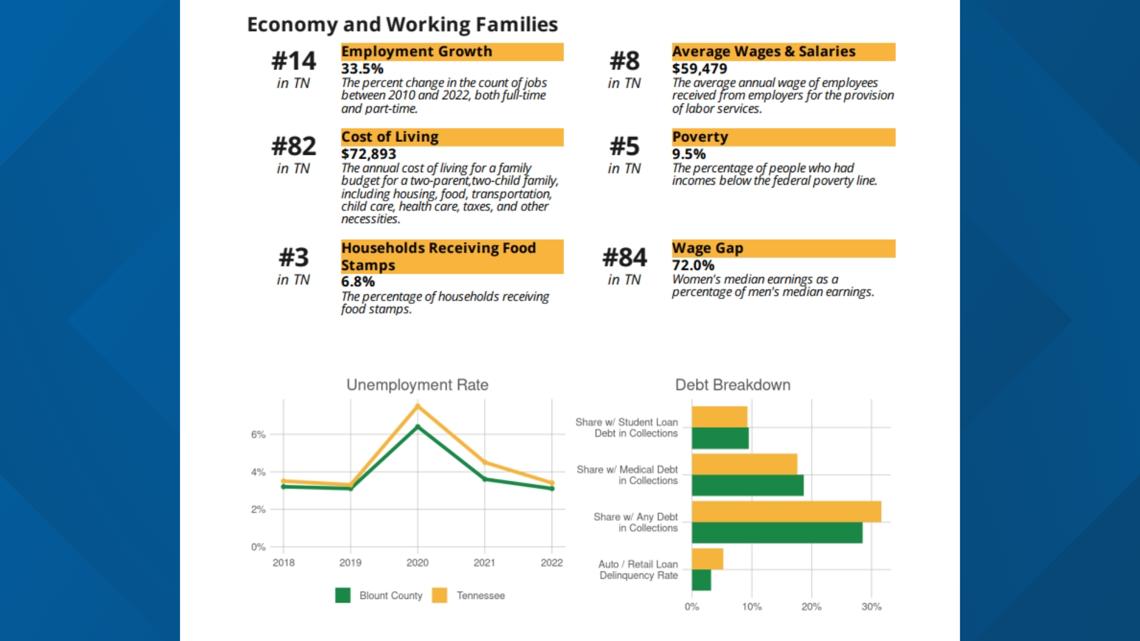
Blount County ranked 82 in cost of living for a two-parent, two-child family, coming in at just over $72,000 with the average wage in the county coming to just over $59,000 per year.
Blount County also saw a 28.6% change in median rent from 2017 to 2022, according to the dashboard.
The dashboard also showed that 9.5% of the county had incomes beneath the poverty line and 28.5% of people had debt in collections. It said its population grew by around 1.7% from 2021 through 2022, and around 74 fatal drug overdoses were reported per 100,000 people, more than the state rate.


